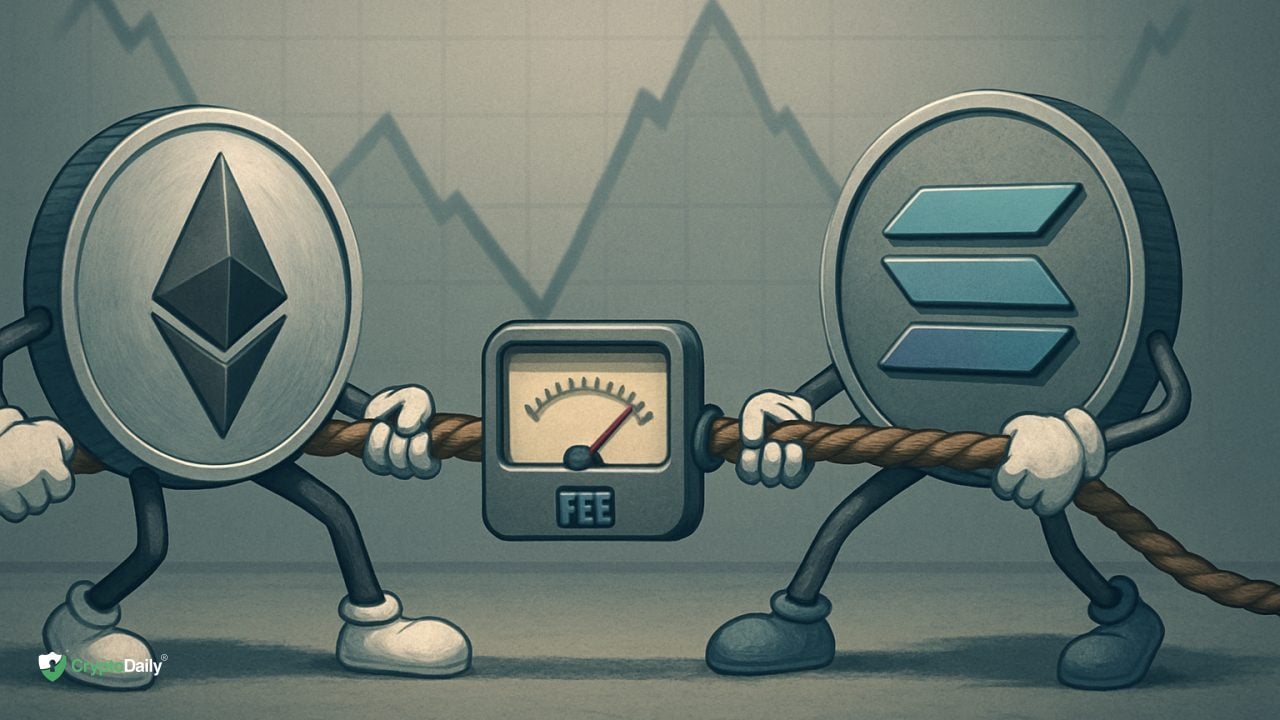
Markets have bounced, liquidity is waking up, and dashboards are green again. The question most teams and traders are asking: which chains are actually earning from the activity — and which ones are surfing headlines?
When price moves blur the picture, on-chain fees and app revenue are a useful north star. They show where users are willing to pay for blockspace and services, and how that demand might translate — or fail to translate — into token value.
This article unpacks the fee demand on Ethereum, Solana, and BNB Chain after the relief bounce, highlighting what is signal, what may be noise, and how to compare chains without falling for misleading metrics.
Aspect
What to Know
Why fees matter
Fees reflect willingness to pay for blockspace and services. Rising paid fees often indicate useful apps with engaged users, not just price volatility.
Market snapshot
Combined fees across tracked protocols recently showed ~$47.96M (24h) and ~$1.653B (30d), per DefiLlama (accessed June 15, 2026).
Solana in May
Solana applications generated roughly $90.62M in app revenue in May 2026 — the month’s highest by chain, per Bitget reporting DefiLlama data.
Ethereum in May
Ethereum’s May 2026 app revenue was around $52M, behind Solana’s, according to Solana Compass (citing DefiLlama).
App concentration
Single protocols can dominate fee prints. In a recent 30-day view, Hyperliquid (~$77.8M) and Pump (pump.fun) (~$63.9M) stood out, per DefiLlama.
BNB Chain today
Low-cost EVM blockspace with a retail-heavy app mix; fee demand tends to be diffuse across DEXes, gaming, and campaigns, with BNB used as gas and separate burn mechanics.
What to monitor next
Trend in priority/gas fees, breadth of paying apps, L2 vs L1 share on Ethereum, and whether May’s leaders retain paying users beyond hype cycles.
Core concepts: how fee demand really forms
Fees are the price of scarce blockspace. When more users and bots compete to get into the next block, the price per unit of computation or message inclusion rises. Sustained, broad willingness to pay tends to correlate with “useful” chains — ones hosting exchanges, games, and services people keep returning to.
“App revenue” and “protocol fees” capture different things. App revenue aggregates what individual protocols — DEXes, perp venues, NFT mints, launchpads — earn from users. Protocol fees are what chains collect from transactions and priority fees. A chain can have robust app revenue without seeing equivalent base-layer fees (e.g., activity on rollups), and vice versa.
Value capture varies by network design. Ethereum’s core value proposition is credible settlement and a wide rollup ecosystem. Its L1 blockspace remains scarce; users increasingly interact through L2s. Fees on L1 may understate end-user activity when rollups are busy, but EIP-1559’s base-fee burn can still tie usage to ETH’s monetary dynamics.
Concentration matters. If one or two breakout apps dominate a chain’s fees, the chain’s demand picture can swing with those apps’ cycles. Broad, diverse fee payers often signal more resilient demand.
Glossary
- Blockspace: The finite throughput a blockchain can include per block; competition for it drives fees.
- App revenue: Income earned by individual applications (e.g., DEX trading fees), distinct from base-layer transaction fees.
- Priority fees: Extra fees paid to speed inclusion; on some chains they go to validators and can spike in busy periods.
- EIP-1559: Ethereum mechanism that burns the base fee per gas, altering ETH’s supply dynamics.
- MEV: Miner/Maximal Extractable Value; value captured by reordering or including transactions, often outside posted “fee” totals.
- Concentration risk: Dependence on a small number of apps for a large share of fees, making demand fragile.
Step-by-step playbook
- Start with a clean fee baseline: Check chain and protocol fees on a neutral dashboard like DefiLlama. Compare 24h vs 30d to separate spikes from trends.
- Cross reference app revenue: Use monthly app-revenue views to see which chains’ applications are actually collecting from users; note May’s gap between Solana and Ethereum as a reference point.
- Decompose by protocol: Identify whether a few apps (e.g., a perp venue or launchpad) explain most of a chain’s fees. High concentration can mean higher reversal risk.
- Map fees to token mechanics: On Ethereum, understand what portion of fees burn ETH. On Solana and BNB, note how priority fees and burn programs allocate value to validators vs token supply.
- Adjust for L2 displacement: For Ethereum, evaluate rollup activity; rising L2 throughput may not fully appear in L1 fees but still strengthens ETH’s settlement role.
- Check persistence signals: Look for weekly cohorts returning to pay again, stablecoin settlement flows, and fees during non-event days rather than just during mints or airdrops.
- Size risk to concentration: If one protocol anchors demand, expect higher volatility; diversify theses across chains or apps to reduce single-point failure.
- Re-test after catalysts: Post-airdrop, post-upgrade, or after major listings, re-run the same checks to confirm whether fee demand held or faded.
ETH, SOL and BNB: three fee engines, three user journeys
Ethereum’s core value proposition is credible settlement and a wide rollup ecosystem. Its L1 blockspace remains scarce; users increasingly interact through L2s. Fees on L1 may understate end-user activity when rollups are busy, but EIP-1559’s base-fee burn can still tie usage to ETH’s monetary dynamics.
Solana compresses latency and cost in a single, high-throughput state machine. Priority fees emerge during heavy demand — often around trading, launches, and high-intensity consumer apps. In May 2026, Solana-led app revenue (~$90.62M) indicates users were paying apps at scale, per Bitget covering DefiLlama data. The question is whether those payers stick.
BNB Chain offers low-cost EVM blockspace with strong retail distribution. Developer ergonomics favor quick EVM ports, and campaigns frequently drive on-chain activity. Fee demand can be broad but thinner per app, making the baseline steady yet less dramatic than breakout chains unless a new flagship emerges.
Aspect
Ethereum
Solana
BNB Chain
Scaling model
L1 settlement + L2 rollups
Monolithic high-throughput L1
High-capacity EVM L1 (with L2 options)
User cost profile
Variable; low on L2, higher on L1 during congestion
Low base cost; priority fees rise in peak windows
Consistently low; suitable for frequent small txs
Value capture
Base fee burn (EIP-1559) + tips to validators
Priority fees to validators; distinct from ETH-style burn
BNB as gas; separate supply-reduction program
App mix
DeFi, NFTs, infra; much end-user flow on L2
High-velocity trading, consumer apps, launches
DEXes, gaming, campaigns; retail-heavy
Fee-spike behavior
Spikes around mints, mempools; L2 buffers users
Spikes around launches and trading surges
Moderate spikes, more diffuse across apps
Concentration risk
Varies; L2 and app dispersion can lower single-point risk
Watch leaders; a few hit apps can define the month
Broad base; upside awaits a breakout flagship
Pro tip: Don’t compare chains by raw transaction counts. Compare dollar-denominated fees paid by users, and check how much accrues to validators vs token burns.
After the bounce: separating signal from noise
A relief rally pulls activity forward. Mints, speculative trading, and incentive programs can briefly inflate fees and app revenues. To separate lasting demand from hype, favor rolling 30-day medians over single-day spikes, and look for repeat payers rather than unique addresses that appear once.
Ethereum’s settlement role complicates simple comparisons. A busy week on rollups can mean tepid L1 fees even as end-user interactions surge. When gauging ETH demand, combine L1 fees, rollup posting costs, and the direction of L2 user fees to understand whether the network’s economic flywheel is accelerating.
Solana often shows visible fee pulses when trading and launch seasons heat up. The May 2026 app-revenue lead suggests strong paying activity across consumer apps; sustainability will depend on whether those users keep paying outside of campaign windows. Watch priority fee trends during “quiet” weeks.
BNB Chain’s retail distribution and low costs can produce resilient baseline usage that doesn’t always translate into eye-catching fee totals. A new flagship (an exchange, a game, a social app) could change the curve quickly; absent that, expect steadier but less dramatic fee prints.
Concentration risk: when a few apps define the chart
Recent protocol-level snapshots highlight how a handful of apps can sway the whole picture. In a 30-day view, Hyperliquid posted roughly $77.8M in fees and Pump (pump.fun) about $63.9M, underscoring that concentrated venues can shape a chain’s apparent demand, per DefiLlama (accessed June 15, 2026).
Concentration isn’t inherently bad — it can mean a breakout product–market fit. But it raises scenario risk: if a top app cools, chain-level fees can whipsaw. Breadth matters. A healthy curve features multiple mid-sized fee payers across categories (DEX, perps, stablecoin rails, gaming) rather than a single monolith.
For comparators, note that May’s app revenue leaders by chain were Solana at roughly $90.62M and Ethereum at about $52M (Bitget; Solana Compass citing DefiLlama). Whether that gap persists will likely hinge on how diversified Solana’s paying apps become and how much Ethereum’s L2-led usage translates into sticky app-side earnings.
Practical takeaway: track the top five fee-generating apps per chain and their combined share. If the top one accounts for the majority, treat the thesis as a single-app exposure wearing a chain costume.
Pitfalls & red flags
- Chasing one-day spikes: Airdrops, NFT mints, or launchpad frenzies can juice fees for 24–72 hours; look for 30–90 day persistence.
- Confusing app revenue with chain fees: A chain can “look quiet” on L1 while its apps or L2s are thriving; use both views before drawing conclusions.
- Ignoring value-capture mechanics: ETH’s base-fee burn is not mirrored on Solana or BNB; don’t assume equal token sensitivity to fee changes.
- Overlooking concentration: If one protocol carries a chain, you’re underwriting app-specific risk, not broad network demand.
- Assuming address growth = demand: Unique wallets can be sybil or campaign-driven; paid fees by returning users are a stronger signal.
- Custody and bridge blind spots: Moving size across chains introduces smart-contract and operational risks; factor them into any allocation plan.
For ongoing on-chain coverage and practical frameworks across markets and narratives, visit Crypto Daily.
Frequently Asked Questions
Do higher fees automatically mean a better investment?
No. Higher fees indicate paying demand, but token value capture depends on mechanics (e.g., burns vs validator revenue), sustainability of usage, and concentration across apps. Treat fees as one input, not a verdict.
Where can I track chain and app fees in one place?
Dashboards like DefiLlama aggregate protocol and chain fees, with 24h/7d/30d views and app-revenue breakdowns. Always cross-check methodology notes before comparing.
How do Ethereum L2s affect ETH fee readings?
Busy rollups can shift end-user fees off L1 while still paying L1 posting costs. Combine L1 base/priority fees with rollup activity to gauge ETH’s overall demand and burn dynamics.
What typically drives Solana fee spikes?
High-throughput trading, token launches, and consumer app waves can push priority fees higher. May 2026’s app-revenue lead suggests those effects were broad, but stickiness needs monitoring in quieter weeks.
Does BNB benefit directly from higher on-chain activity?
BNB is used for gas on BNB Chain, and the ecosystem employs supply-reduction mechanisms. However, the linkage between fee growth and net token supply differs from Ethereum’s burn and should be evaluated on its own terms.
How do I tell if fee demand is concentrated?
Sort apps by 30-day fees on each chain and add the top five’s share. If a single venue accounts for an outsized percentage, demand may be fragile and sensitive to that app’s cycle.
What’s the best single metric to watch after a market bounce?
There isn’t one. Use a basket: 30–90 day paid fees, breadth of fee-paying apps, rollup activity (for ETH), and persistence of stablecoin throughput — together they tell a clearer story.
Disclaimer: This article is provided for informational purposes only. It is not offered or intended to be used as legal, tax, investment, financial, or other advice.