Bitcoin’s break below the $60,000 area has pushed digital asset markets into a more defensive phase, ending months of narrow trading and exposing a market structure that traders say could amplify the next major move.
CryptoSlate’s data show the largest cryptocurrency had been moving sideways since February, when it first tested the $60,000 area.
That long consolidation made the level a widely watched marker for traders, even as macro risks, spot exchange-traded fund outflows and concerns around corporate Bitcoin holders weighed on sentiment.
As a result, the latest decline points to a more fragile setup where large amounts of Bitcoin have moved toward major exchanges, open interest is rising while spot prices remain weak, and professional traders are paying more to protect against another leg lower.
Bitcoin’s break turns exchange flows into a supply test
The clearest sign of stress has appeared in exchange-linked flows.
CryptoQuant data show more than 550,000 BTC moved to deposit addresses linked to Binance and OKX after Bitcoin slipped below the $60,000 area. Binance-linked deposit addresses received more than 220,000 BTC, while OKX-linked addresses received more than 330,000 BTC.
Those figures are well above this year’s normal readings. Binance has averaged about 60,000 BTC in comparable inflows, while OKX has averaged about 95,000 BTC, according to CryptoQuant data.
The latest transfers are the largest of the year and resemble levels last seen during the 2023 bear market.

In cryptocurrency market architecture, a sudden transfer of coins to exchange deposit addresses functions as an initial operational indicator of intent. Users typically route assets to these specific points before funds are aggregated into a platform’s central hot wallets for execution, lending, or collateral assignment.
Still, the timing gives the data more weight. Large transfers toward exchanges during a price decline often raise concern that more supply could become available if the market weakens further.
In a market already trading below a level many investors had watched for months, that potential supply overhang can make rebounds harder to sustain.
The flow also reflects how range-bound markets can become unstable once a familiar level breaks. When traders spend months reacting to the same zone, risk controls, hedges and stop-loss decisions can cluster around it. Once the level gives way, many participants reassess exposure at the same time.
That is why the exchange data are central to the current setup. The market is not only dealing with a lower Bitcoin price. It is also dealing with the possibility that more coins have moved closer to venues where holders can act quickly.
Valuation reset reduces excess, but not volatility risk
The exchange flows are arriving as Bitcoin’s on-chain valuation metrics show that much of the earlier cycle’s excess has already been compressed.
CryptoQuant’s MVRV Z-Score shows Bitcoin’s valuation premium has fallen sharply, moving closer to historical low-valuation areas.
The MVRV framework compares Bitcoin’s market value with its realized value. Market value reflects the current price of circulating coins, while realized value estimates the network’s aggregate cost basis by valuing each coin at the price where it last moved on-chain.
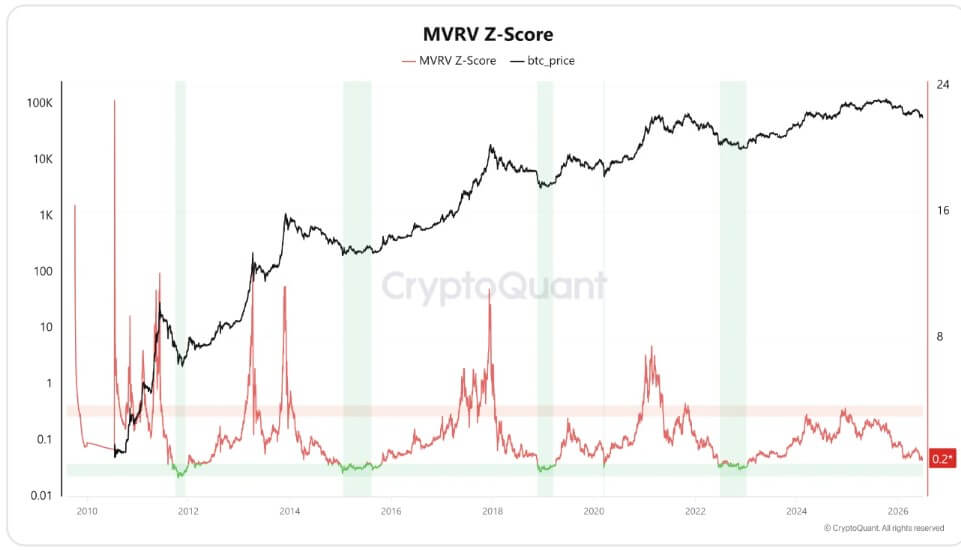
When market value trades far above realized value, unrealized profits are usually elevated and cyclical risk tends to rise. As the gap narrows, profitability declines, and some speculative pressure eases.
The Z-Score adjusts that relationship by measuring the distance between market value and realized value against Bitcoin’s historical market-cap deviation. That helps traders judge whether Bitcoin is trading near unusually stretched or compressed valuation levels compared with its own history.
The current reading suggests the market has moved closer to reset territory.
However, the indicator does not identify a precise bottom. Bitcoin has traded near cheaper valuation zones before while prices continued to weaken, particularly during periods of poor liquidity, forced selling, or macro stress.
That distinction is important now because valuation and positioning are sending different messages. On-chain data suggest the market is less stretched than it was earlier in the cycle. Market structure data suggest traders are still preparing for a disorderly move.
CryptoQuant data show funding rates across major exchanges have moved back into positive territory while Bitcoin remains weak around the $59,000 to $60,000 area. Positive funding generally means traders holding long positions are paying shorts, a sign that demand for bullish exposure has returned after a more negative stretch.
At the same time, open interest is rising while spot prices remain soft. That means new positions are being built into the decline rather than risk leaving the system.
The combination can make price action more sensitive. If Bitcoin falls further, newly opened long positions could come under pressure. If the market rebounds sharply, traders positioned for more downside may be forced to cover.
Either outcome could make the next move larger than the spot market alone would suggest.
Downside hedges build as institutional interest weakens
To manage this heightened structural uncertainty, institutional traders are aggressively building a defensive position in the options markets.
Singapore-based digital asset trading firm QCP Capital reports that implied volatility metrics are trending systematically higher as market participants pay a premium for downside protection.
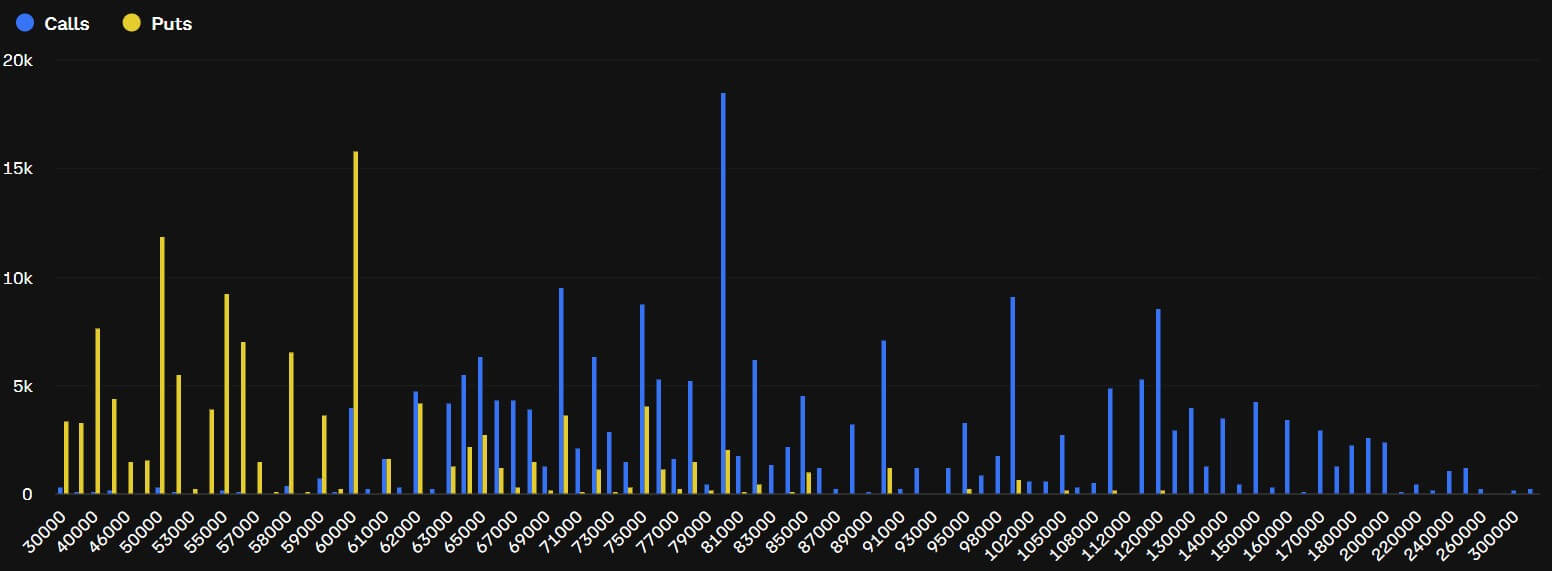
According to the firm, demand has centered on July-expiry Bitcoin put options with strike prices between $55,000 and $58,000.
Data from the digital asset derivatives exchange Deribit reinforces this narrative, showing roughly $1.2 billion in open interest clustered specifically at the $55,000 and $50,000 strike zones.
Compounding this defensive positioning is a structural shift in institutional capital flows.
Data from blockchain analytics firm Glassnode reveals that institutional demand is no longer acting as a reliable sponge for circulating supply. Over the past month, spot Bitcoin exchange-traded funds (ETFs) shed approximately 71,600 BTC, while digital asset trusts added only a marginal 7,500 BTC.
When adjusted for network issuance, the combined net institutional capital flow is -77,000 BTC.
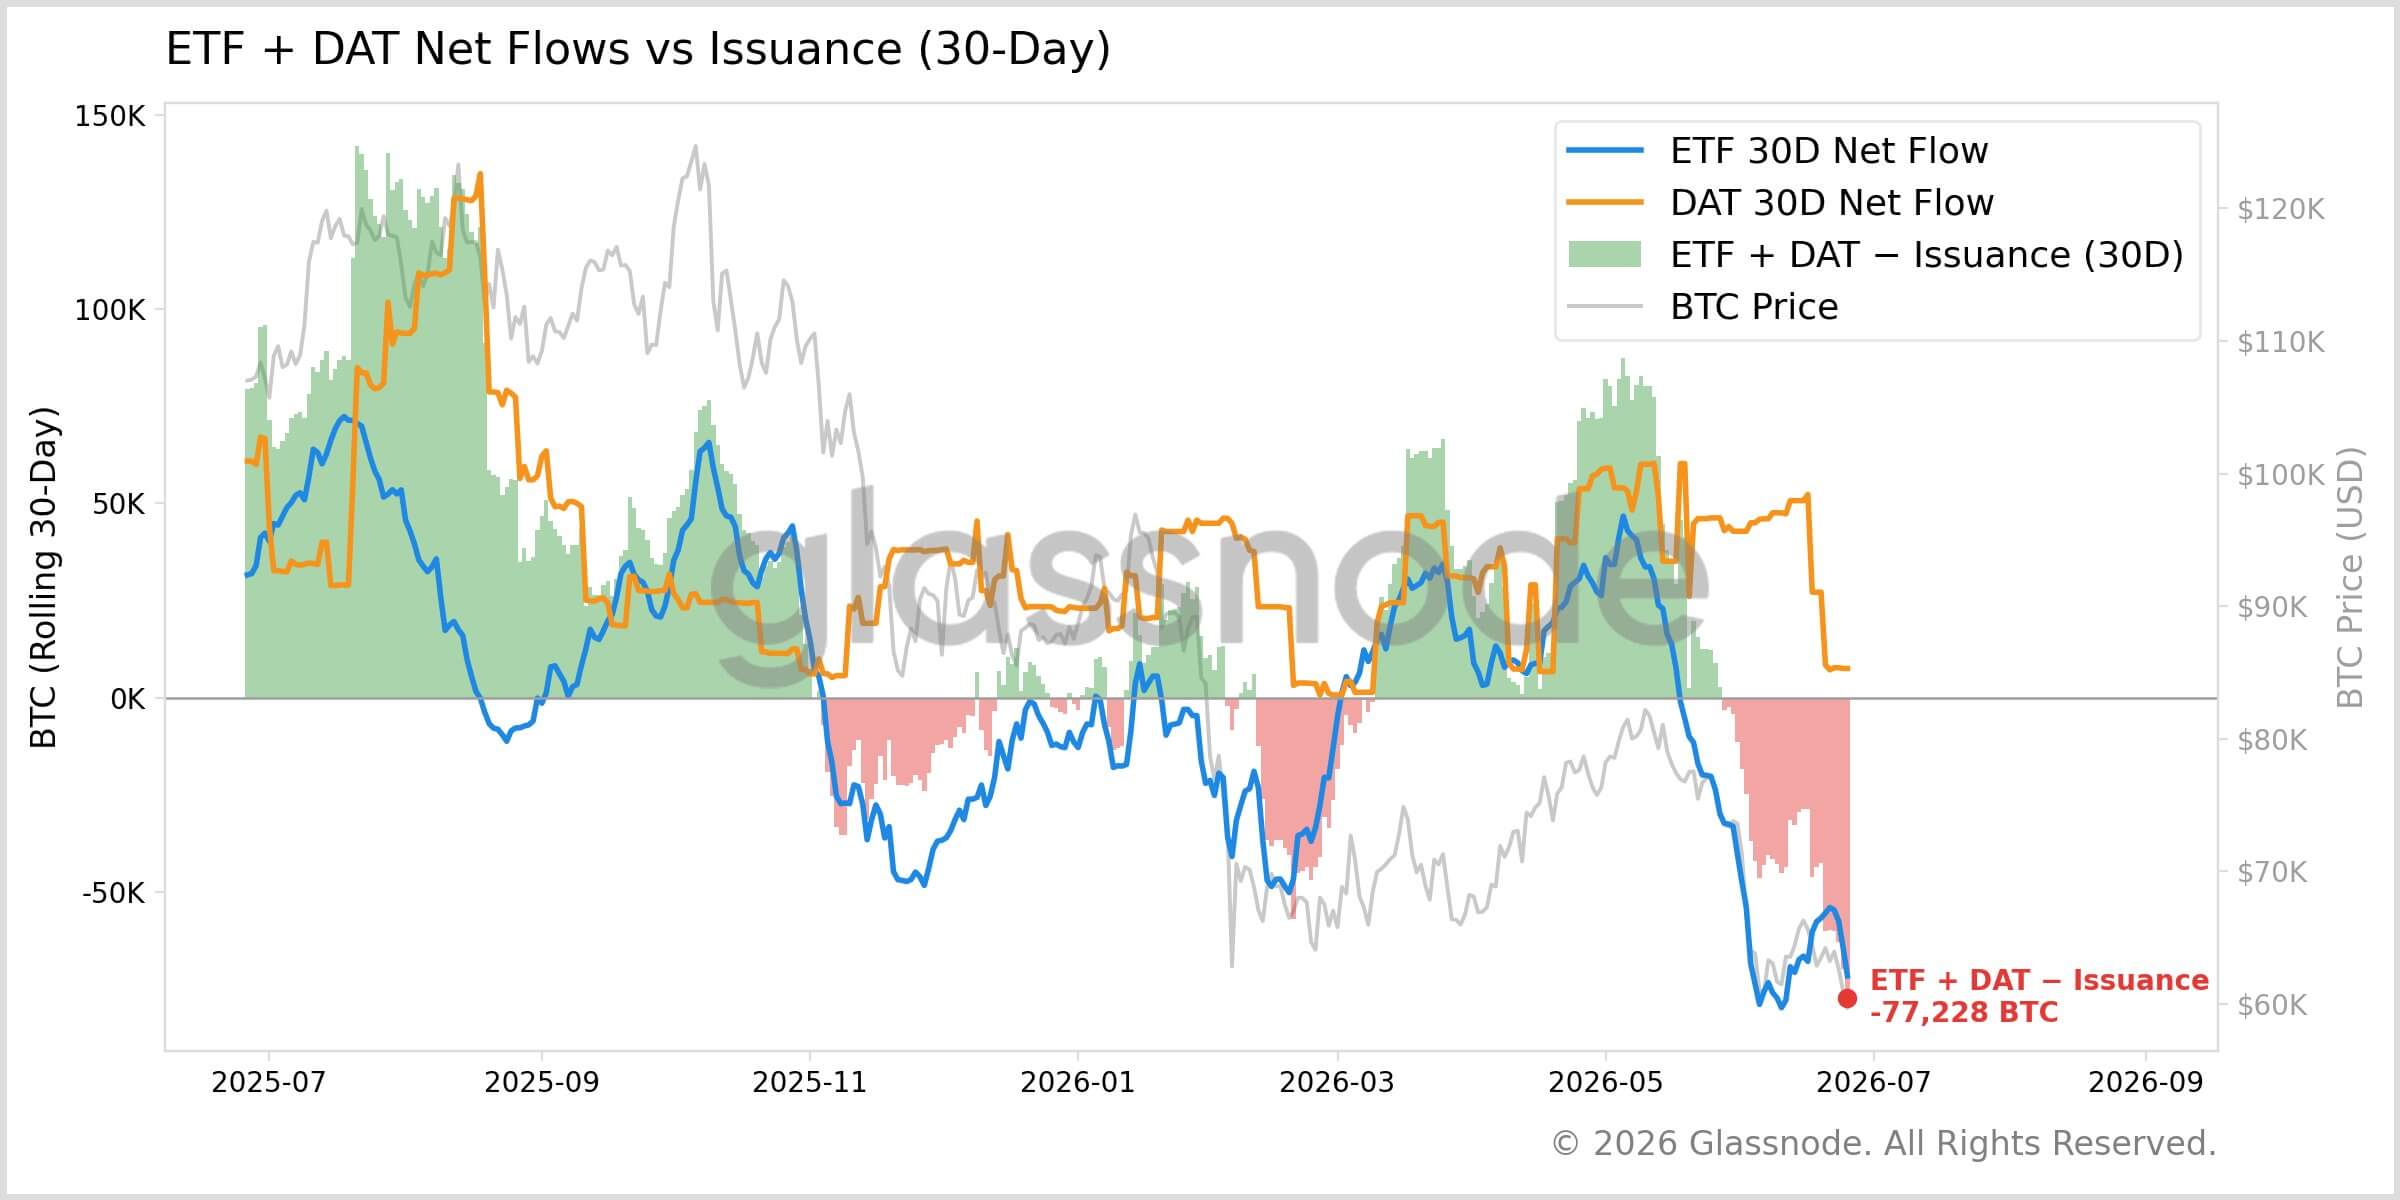
According to Glassnode’s analysis, any near-term spot market recovery will face immediate friction from this persistent wrapper supply overhang until net flows reverse.
This institutional deleveraging trend is explicitly quantified by BlockScholes, whose proprietary Bitcoin risk indices have remained fixed below the -1.0 threshold for more than 23 consecutive days.
BlockScholes notes that the longevity of this trend marks a departure from typical cyclical dips, signaling an ongoing, structural risk reduction by institutional allocators that will likely require a fundamental macroeconomic or industry-specific catalyst to alter.
That leaves Bitcoin in a fragile position after its break below the $60,000 area. On-chain valuation metrics suggest the market has already shed much of its earlier excess, but exchange flows, options positioning, and institutional demand all point to a market still preparing for stress.
The immediate test is whether spot demand can absorb the supply now sitting closer to exchanges. If demand improves, defensive positioning could help fuel a rebound.
If it does not, the same structure could turn the $60,000 break into a broader shock to volatility.