Close Menu
Cryphedge.com
  • Home
  • Crypto News
    • Bitcoin
    • NFT News
  • Altcoins
  • Scams
  • Blockchain
  • Regulations
  • Trading
Facebook X (Twitter) Instagram
Cryphedge.com
  • Home
  • Crypto News
    • Bitcoin
    • NFT News
  • Altcoins
  • Scams
  • Blockchain
  • Regulations
  • Trading
Cryphedge.com
Home » Bitcoin just slipped below the bear-market line traders cannot ignore
Bitcoin just slipped below the bear-market line traders cannot ignore

Bitcoin just slipped below the bear-market line traders cannot ignore

June 28, 20266 Mins ReadNo Comments Trading
Share
Facebook Twitter LinkedIn Pinterest Email

Bitcoin’s move below the 200-week moving-average area has turned a familiar cycle marker into a live demand test.

On Sunday, June 28, BTC traded at $60,238, down 6.1% over the past 7 days and 18% over the past 30 days. That left the spot below the 200-week weighted moving average, tracked by Newhedge at $62,383, after three heavy ETF redemption sessions.

The line now separates two near-term outcomes. A move back through the low-$62,000 area would suggest forced selling and ETF redemptions temporarily pushed Bitcoin through a level long-term holders watch. More time below it would turn the old stress marker into potential overhead resistance.

The market’s focus on the level is visible in other 200-week moving-average dashboards and in social posts that framed the break as a cycle warning. A moving average can organize the test. Flow and time below the line supply the answer.

The Bitcoin price repair level is close

The 200-week weighted average is important because it compresses years of price behavior into a single slow-moving reference. Bitcoin has historically spent limited time below it during severe drawdowns, which is why traders treat it as a cycle-level stress marker.

In this setup, the gap is concrete. Bitcoin sits roughly $2,555 below Newhedge’s 200-week weighted moving average. That is close enough for volatility to challenge quickly, yet large enough that hovering near $60,000 leaves the break unresolved.

The 200-day marker is part of a larger repair sequence. Barchart’s technical screen showed Bitcoin’s 200-day simple moving average at $84,165, far above spot. A 200-week reclaim here would test whether the breakdown is accepted; a 200-day reclaim would signal broader trend repair.

That sequence keeps the signal clean. Bitcoin can recover the 200-week line and remain in a damaged trend, while repeated failures below the 200-week area would keep pressure on the idea that the move is only a liquidation event.

ETF redemptions turned the line into a flow test

The flow backdrop makes the current move harder to dismiss as a pure chart event. Farside Investors’ Bitcoin ETF table showed net outflows of $469 million on Jun. 24, $691 million on Jun. 25, and $444 million on Jun. 26.

Bitcoin just slipped below the bear-market line traders cannot ignore
Related Reading

Did $6B in ETF outflows just mark Bitcoin’s first Wall Street capitulation?

Six weeks of relentless Bitcoin ETF outflows have investors asking whether institutional conviction has finally broken.

Jun 27, 2026 · Andjela Radmilac

Together, those sessions represented about $1.61 billion in net redemptions. They show that the break arrived while one of the main institutional demand channels was removing support.

Capitulation would require evidence that sellers are exhausting themselves and that buyers are absorbing supply near the level. Continued ETF redemptions would run counter to this, making a reclaim harder to sustain.

Recent CryptoSlate coverage has already addressed the near-term setup, including the $58,000 weekend exhaustion-versus-acceptance question, the ETF outflow and inflation backdrop, and liquidation pressure around the failed $60,000 rebound.

Bitcoin nearly loses $58K as ETF outflows decide whether inflation relief holdsBitcoin nearly loses $58K as ETF outflows decide whether inflation relief holds
Related Reading

Bitcoin nearly loses $58K as ETF outflows decide whether inflation relief holds

With Bitcoin price struggling to reclaim $60,000 after a near-break of $58,000, the next move depends on whether inflation data, Fed expectations and risk appetite give bulls enough room to defend support.

Jun 26, 2026 · Gino Matos

The fresh issue is whether selling pressure has pushed Bitcoin through a line that longer-cycle traders will defend, or whether the same flows make that line less relevant until demand improves.

Macro conditions add outside pressure. In its Jun. 17 statement, the Federal Reserve held its target range at 3.50% to 3.75% and said inflation remained elevated.

The Fed’s June projection materials showed a median 2026 funds rate of 3.8%, while the May employment report showed payrolls rising by 172,000 and unemployment at 4.3%.

CryptoSlate Daily Brief

Daily signals, zero noise.

Market-moving headlines and context delivered every morning in one tight read.

5-minute digest 100k+ readers

Free. No spam. Unsubscribe any time.

Whoops, looks like there was a problem. Please try again.

You’re subscribed. Welcome aboard.

Bitcoin’s $60K rebound just collapsed as $427M in long liquidations followed sticky inflation dataBitcoin’s $60K rebound just collapsed as $427M in long liquidations followed sticky inflation data
Related Reading

Bitcoin’s $60K rebound just collapsed as $427M in long liquidations followed sticky inflation data

Sticky inflation, firmer activity data, and lower claims left buyers without the rate-cut cover they needed.

Jun 25, 2026 · Liam ‘Akiba’ Wright

A resilient labor market and sticky inflation backdrop can keep rate-cut expectations from becoming an immediate tailwind for risk assets. Under those conditions, Bitcoin needs real demand to reclaim the 200-week area rather than simple relief from the flush of leverage.

A widely circulated X post captured trader psychology around the moving-average break. Social attention explains why the line is visible; price, ETF flows, and macro conditions decide whether visibility becomes support.
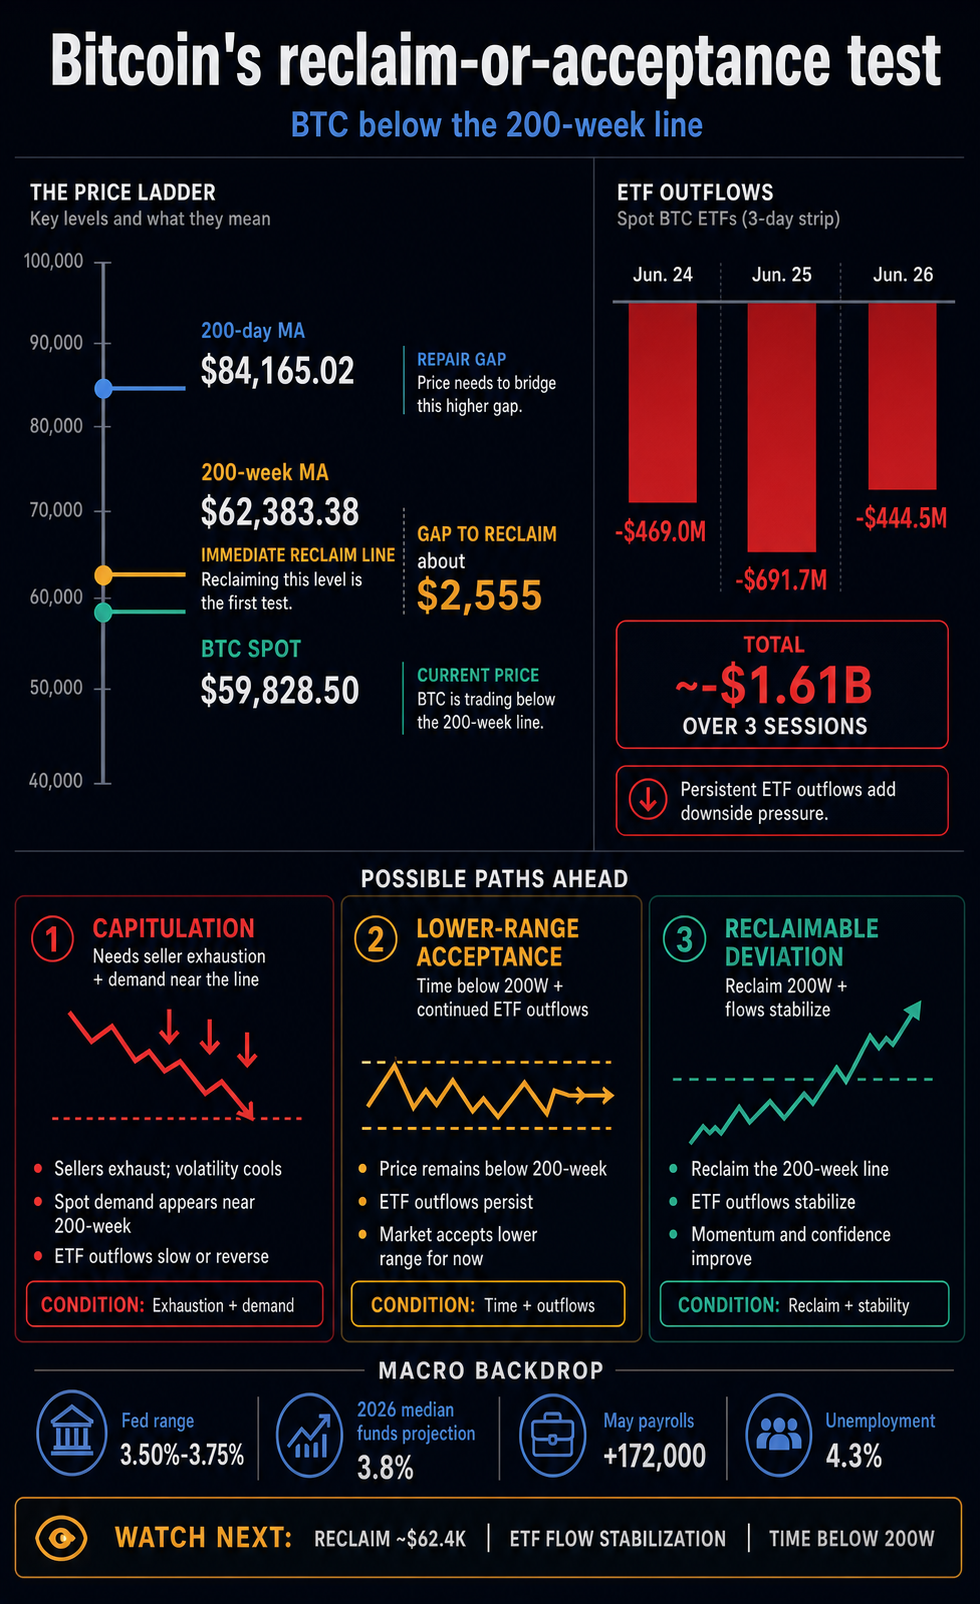
Infographic mapping Bitcoin spot price, 200-week and 200-day moving averages, ETF outflows, macro backdrop, and three reclaim-or-acceptance scenarios.

The three outcomes have different confirmations

The cleanest way to track the break is through conditions rather than forecasts. The same price zone can support three different interpretations depending on what happens next.

Scenario What supports it What weakens it Marker to watch
Capitulation Heavy ETF outflows and a fast drop below a watched long-term line Persistent redemptions and no durable reclaim BTC back above the 200-week area with ETF flows stabilizing
Lower-range acceptance Repeated trading below the 200-week average while ETF outflows continue A swift reclaim with improving demand Time spent below roughly $62,383 and the next Farside flow updates
Reclaimable deviation Spot remains close to the 200-week average and the 200-day marker is a longer repair target Failure to regain the line despite easing selling pressure A close back above the 200-week average, then progress toward broader trend repair

The capitulation case starts with the violence of the move: forced selling, ETF redemptions, and a sharp weekly drawdown arrived together. Confirmation would require absorption near the 200-week area and a fast return above it.

Lower-range acceptance strengthens if Bitcoin remains below the 200-week average while ETF flows remain negative. That would show buyers are allowing the old stress line to become resistance.

The reclaimable-deviation case remains viable because spot is still close to the 200-week reference. A push back above the low-$62,000 area, especially alongside smaller ETF outflows or renewed inflows, would make the break look more like a reset than a shift into a lower regime.

Even then, the 200-day average remains far overhead, so a 200-week reclaim would only be the first repair step.

The current evidence indicates that the acceptance test is still in progress. Bitcoin has crossed below the market’s bear-market line, but flows and time around the low-$62,000 area will determine whether that line becomes a floor again or the ceiling of a lower range.

Share. Facebook Twitter Pinterest LinkedIn Tumblr Email
cryphedge

Related Posts

BitMine is now $484 million away from completing its 5% Ethereum target

July 21, 2026

Bitcoin gets $2.5B target for $72,000 by August as unknown trader bets big on Fed rally

July 20, 2026

Hyperliquid challenges Polymarket with $32 million opening for prediction-market builders

July 20, 2026

Bitcoin whale dumps $122 million 40x long right before liquidation can strike

July 20, 2026
Add A Comment
Leave A Reply Cancel Reply

Editors Picks

BitMine is now $484 million away from completing its 5% Ethereum target

July 21, 2026

XRP Price is Breaking Out—Can Bulls Fuel a 5% Rally to $1.20?

July 21, 2026

Bitcoin ETFs Post First Five-Day Inflow Streak Since April as Institutional Demand Returns

July 21, 2026

Bitcoin and Ethereum Set To Extend Gains, but Remittix Could Offer Best Value With New Offerings

July 21, 2026
About

cryphedge is an online news portal that aims to share the latest crypto news, bitcoin, altcoin, blockchain, nft news, regulation, trading, crypto scams and much more stuff.

Facebook X (Twitter) Instagram Pinterest YouTube
Top Insights

Korbit Hit With $1.8M Fine as South Korea Flags Major AML Failures

December 31, 2025

Time Running Out to Buy Shiba Inu Coin Before Price Surge

August 24, 2025

Hyra Network Powers New Frontiers in Decentralized AI and Strategic Growth

May 6, 2025
Subscribe
Please enable JavaScript in your browser to complete this form.

Loading
  • Contact Us
  • Disclaimer
  • Privacy Policy
  • Terms of Use
  • DMCA

Type above and press Enter to search. Press Esc to cancel.

  • bitcoinBitcoin(BTC)$66,601.002.04%
  • ethereumEthereum(ETH)$1,926.551.68%
  • tetherTether(USDT)$1.000.03%
  • binancecoinBNB(BNB)$574.560.34%
  • usd-coinUSDC(USDC)$1.000.01%
  • rippleXRP(XRP)$1.153.76%
  • solanaSolana(SOL)$77.951.18%
  • tronTRON(TRX)$0.3283300.92%
  • Figure HelocFigure Heloc(FIGR_HELOC)$1.00-0.72%
  • HyperliquidHyperliquid(HYPE)$61.600.19%
  • dogecoinDogecoin(DOGE)$0.0731860.13%
  • USDSUSDS(USDS)$1.000.01%
  • RainRain(RAIN)$0.014173-0.03%
  • zcashZcash(ZEC)$539.48-0.44%
  • leo-tokenLEO Token(LEO)$9.710.12%
  • WhiteBIT CoinWhiteBIT Coin(WBT)$57.952.07%
  • stellarStellar(XLM)$0.1926222.15%
  • cardanoCardano(ADA)$0.1747556.07%
  • moneroMonero(XMR)$346.993.45%
  • chainlinkChainlink(LINK)$8.672.19%
  • CantonCanton(CC)$0.1254891.25%
  • daiDai(DAI)$1.000.02%
  • bitcoin-cashBitcoin Cash(BCH)$225.084.13%
  • USD1USD1(USD1)$1.000.01%
  • Gram (prev. Toncoin)Gram (prev. Toncoin)(GRAM)$1.526.77%
  • Ethena USDeEthena USDe(USDE)$1.000.01%
  • litecoinLitecoin(LTC)$47.691.02%
  • Global DollarGlobal Dollar(USDG)$1.00-0.20%
  • suiSui(SUI)$0.760.56%
  • hedera-hashgraphHedera(HBAR)$0.0686013.47%
  • Circle USYCCircle USYC(USYC)$1.13-0.01%
  • avalanche-2Avalanche(AVAX)$6.600.27%
  • PayPal USDPayPal USD(PYUSD)$1.000.00%
  • crypto-com-chainCronos(CRO)$0.0583421.29%
  • nearNEAR Protocol(NEAR)$1.95-0.64%
  • BlackRock USD Institutional Digital Liquidity FundBlackRock USD Institutional Digital Liquidity Fund(BUIDL)$1.000.00%
  • shiba-inuShiba Inu(SHIB)$0.0000041.12%
  • tether-goldTether Gold(XAUT)$4,070.941.58%
  • uniswapUniswap(UNI)$3.653.48%
  • Ondo US Dollar YieldOndo US Dollar Yield(USDY)$1.140.01%
  • OndoOndo(ONDO)$0.40653815.97%
  • BittensorBittensor(TAO)$199.642.20%
  • pax-goldPAX Gold(PAXG)$4,067.411.57%
  • World Liberty FinancialWorld Liberty Financial(WLFI)$0.056618-0.80%
  • okbOKB(OKB)$82.081.56%
  • AsterAster(ASTER)$0.630.66%
  • HTX DAOHTX DAO(HTX)$0.0000020.26%
  • Ripple USDRipple USD(RLUSD)$1.000.00%
  • MemeCoreMemeCore(M)$1.19-2.81%
  • usddUSDD(USDD)$1.00-0.01%
  • SkySky(SKY)$0.0634493.93%
  • aaveAave(AAVE)$95.026.50%
  • polkadotPolkadot(DOT)$0.853.87%
  • Falcon USDFalcon USD(USDF)$1.00-0.10%
  • mantleMantle(MNT)$0.4290520.70%
  • WorldcoinWorldcoin(WLD)$0.3777021.45%
  • MorphoMorpho(MORPHO)$2.022.35%
  • BFUSDBFUSD(BFUSD)$1.000.02%
  • internet-computerInternet Computer(ICP)$2.233.36%
  • PepePepe(PEPE)$0.0000030.02%
  • bitget-tokenBitget Token(BGB)$1.702.97%
  • ethereum-classicEthereum Classic(ETC)$7.001.84%
  • United StablesUnited Stables(U)$1.00-0.03%
  • Spiko EU T-Bills Money Market FundSpiko EU T-Bills Money Market Fund(EUTBL)$1.20-0.02%
  • Pi NetworkPi Network(PI)$0.092220-8.19%
  • USDGOUSDGO(USDGO)$1.00-0.01%
  • Blockchain CapitalBlockchain Capital(BCAP)$106.200.01%
  • ​​Stable​​Stable(STABLE)$0.0388198.82%
  • quant-networkQuant(QNT)$64.421.23%
  • kucoin-sharesKuCoin(KCS)$6.710.36%
  • Janus Henderson Anemoy Treasury FundJanus Henderson Anemoy Treasury Fund(JTRSY)$1.110.01%
  • POL (ex-MATIC)POL (ex-MATIC)(POL)$0.0803670.65%
  • ADIADI(ADI)$6.771.15%
  • Spiko Amundi Overnight Swap Fund (EUR)Spiko Amundi Overnight Swap Fund (EUR)(EURSAFO)$1.15-0.06%
  • justJUST(JST)$0.1002940.91%
  • EthenaEthena(ENA)$0.0856712.99%
  • render-tokenRender(RENDER)$1.542.16%
  • Pump.funPump.fun(PUMP)$0.001976-2.64%
  • kaspaKaspa(KAS)$0.0283630.77%
  • cosmosCosmos Hub(ATOM)$1.490.45%
  • nexoNEXO(NEXO)$0.772.04%
  • Invesco Short Duration US Government Securities FundInvesco Short Duration US Government Securities Fund(USTB)$11.150.03%
  • algorandAlgorand(ALGO)$0.0845201.97%
  • AudieraAudiera(BEAT)$2.33-6.95%
  • gatechain-tokenGate(GT)$6.760.26%
  • Janus Henderson Anemoy AAA CLO FundJanus Henderson Anemoy AAA CLO Fund(JAAA)$1.040.02%
  • JupiterJupiter(JUP)$0.1983601.34%
  • BeldexBeldex(BDX)$0.083110-0.53%
  • GHOGHO(GHO)$1.000.05%
  • filecoinFilecoin(FIL)$0.753.98%
  • Venice TokenVenice Token(VVV)$12.628.92%
  • 币安人生 (BinanceLife)币安人生 (BinanceLife)(币安人生)$0.59-5.71%
  • arbitrumArbitrum(ARB)$0.089488-1.46%
  • xdce-crowd-saleXDC Network(XDC)$0.0291722.66%
  • LighterLighter(LIT)$2.313.17%
  • FlareFlare(FLR)$0.0065681.17%
  • YLDSYLDS(YLDS)$1.000.02%
  • Usual USDUsual USD(USD0)$1.000.03%
  • injective-protocolInjective(INJ)$5.27-0.66%
  • USXUSX(USX)$1.00-0.02%