Bitcoin’s price has dropped below $75,000 for the first time since mid-April, triggering a broad decline across digital assets.
Data from CryptoSlate showed that the largest digital asset fell more than 3% over the past 24 hours to as low as $74,255 after trading above $77,000 earlier in the session. The move placed Bitcoin back at a price zone last seen in April, when the market was still recovering from a wider risk-asset reset.
The decline also spread across the broader crypto market, where Ethereum fell about 5% to roughly $2,065, while Hyperliquid, one of the stronger performers in recent weeks, dropped more than 7% to about $55.
Other top digital assets, including XRP, Cardano, BNB, Solana, and Dogecoin, also traded lower as selling pressure widened across the market.
The reversal came despite recent regulatory momentum around the CLARITY Act, which had helped bolster expectations that a clearer US market structure could attract more capital to the sector.
Instead, market data showed that traders have shifted attention back to demand, fund flows, and leverage after Bitcoin failed to hold the $75,000 level.

BTC spot demand weakens as ETFs turn into sellers
Market analysts attribute the pullback to a combination of technical exhaustion and a sharp reduction in institutional appetite.
CryptoQuant head of research Julio Moreno said Bitcoin spot demand is contracting at the fastest pace since Jan. 10, pointing to a weakening base for the market as the price tested a critical technical zone.
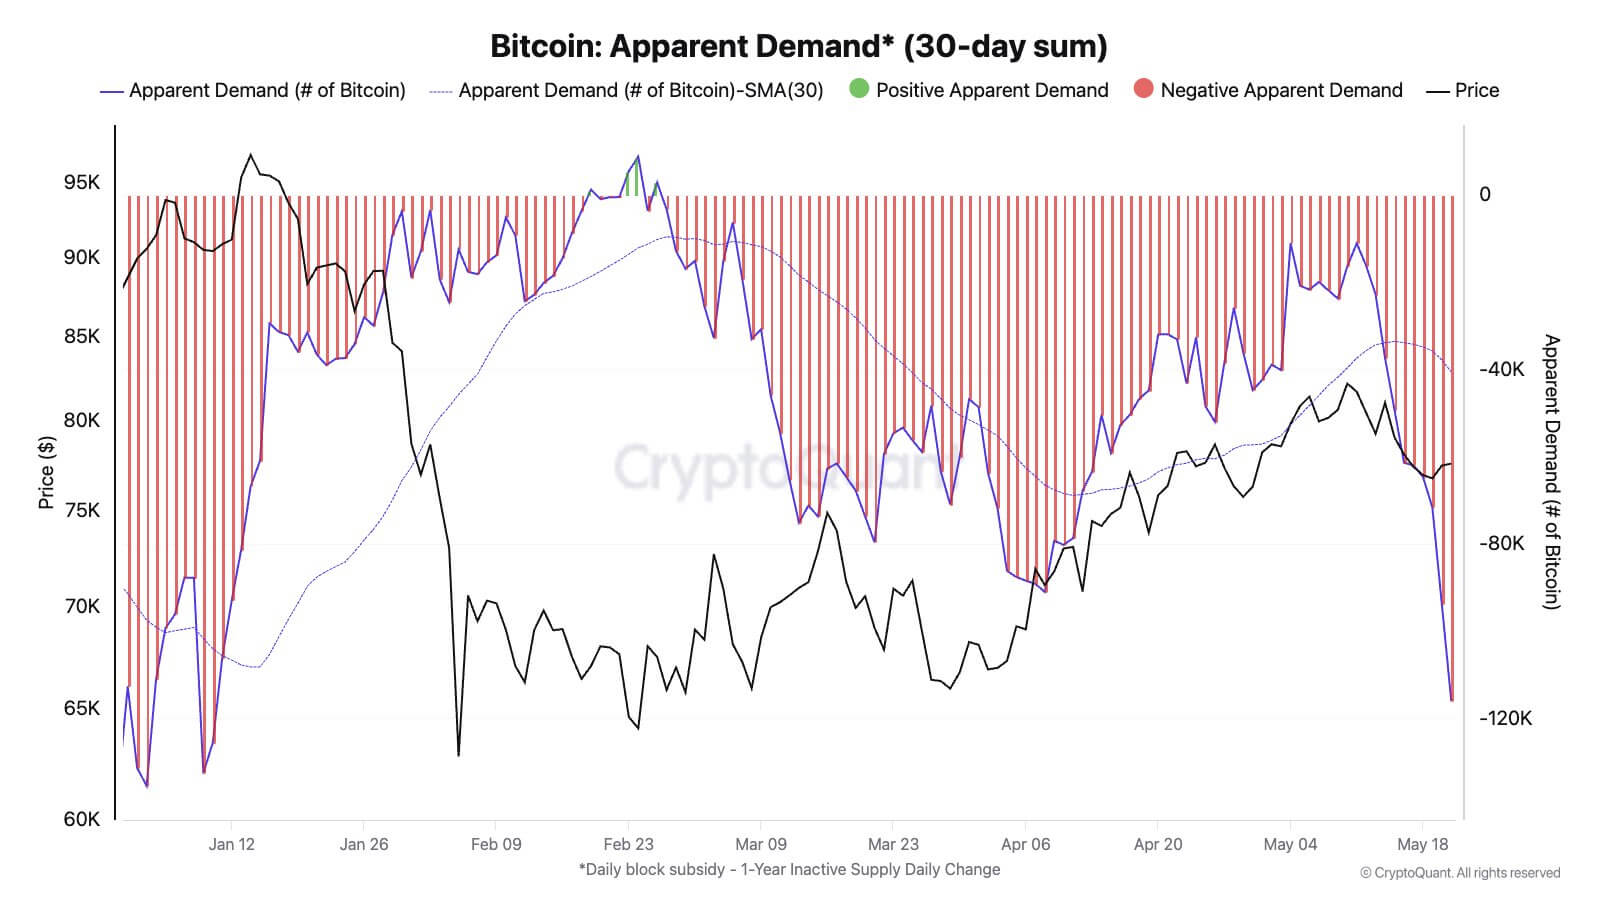
That pressure is evident in US spot Bitcoin ETFs, which have recorded more than $2 billion in cumulative outflows over the past two weeks. The withdrawals mark one of the fastest two-week exits from the funds and remove a source of demand that had helped stabilize Bitcoin during earlier phases of the rally.
The shift in ETF flows is important because spot funds had served as one of the main channels for institutional allocation into Bitcoin.
When those funds receive inflows, issuers typically need to acquire Bitcoin to support the issuance of new shares. When the funds post outflows, that support can reverse, leaving the market more dependent on direct spot buying and derivatives positioning.
Ultimately, Bitcoin’s latest pullback came after the asset met resistance near levels that had previously capped rebounds.
With spot demand weakening and ETF flows turning negative, the move above $77,000 lacked the follow-through needed to sustain a move above the $75,000 threshold.
Nearly $1 billion in positions liquidated
The fall below $75,000 triggered a sharp liquidation wave across crypto derivatives markets, where traders using leverage were forced out as prices moved through key levels.
Data from Coinglass shows that $941 million in derivative positions were liquidated across the market within 24 hours, affecting more than 161,200 individual traders as prices sliced through key support levels.
Bitcoin-linked contracts were the hardest hit, enduring more than $378 million in liquidations. Ethereum derivatives traders saw approximately $255 million in positions forcefully closed.
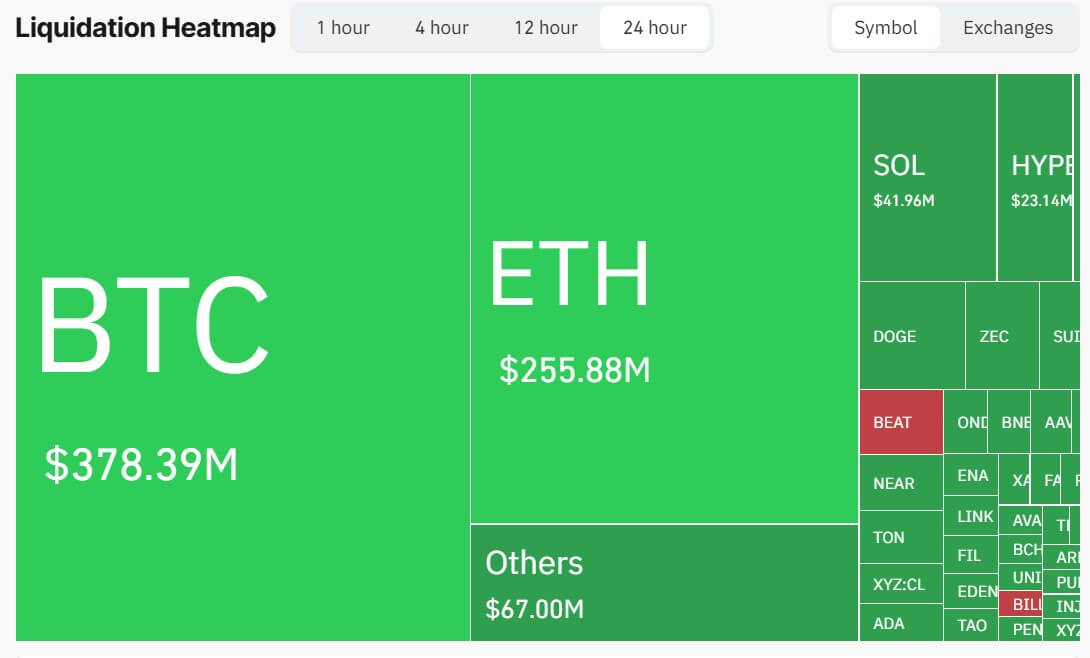
The single largest liquidation order across all platforms occurred on the Bitget exchange, where a $32.4 million Bitcoin swap contract was wiped out.
Meanwhile, bullish traders absorbed the vast majority of the financial damage. Liquidations of long positions, which are bets that prices would continue to rise, accounted for roughly $870 million of the total wipeout. In contrast, traders holding short positions lost just $71.4 million.
The imbalance between long and short liquidations shows that the market had been positioned for higher prices before the selloff.
However, once Bitcoin price lost support near $75,000, forced selling added to the pressure already created by ETF outflows and weaker spot demand.
Bitcoin risk metrics signal peak pessimism
Following these developments, BTC’s on-chain metrics suggest the market is entering a phase of significant historical stress that could further impact its price.
Joao Wedson, chief executive officer of data analytics firm Alphractal, highlighted a divergence in the risk-adjusted performance of the market’s two largest assets.
According to Wedson, Bitcoin’s annualized Sharpe ratio has turned negative, indicating an environment of elevated pressure and poor return efficiency relative to the underlying risk. Ethereum’s Sharpe ratio, meanwhile, is hovering near zero, indicating a neutral environment that offers investors no clear premium for taking on exposure.
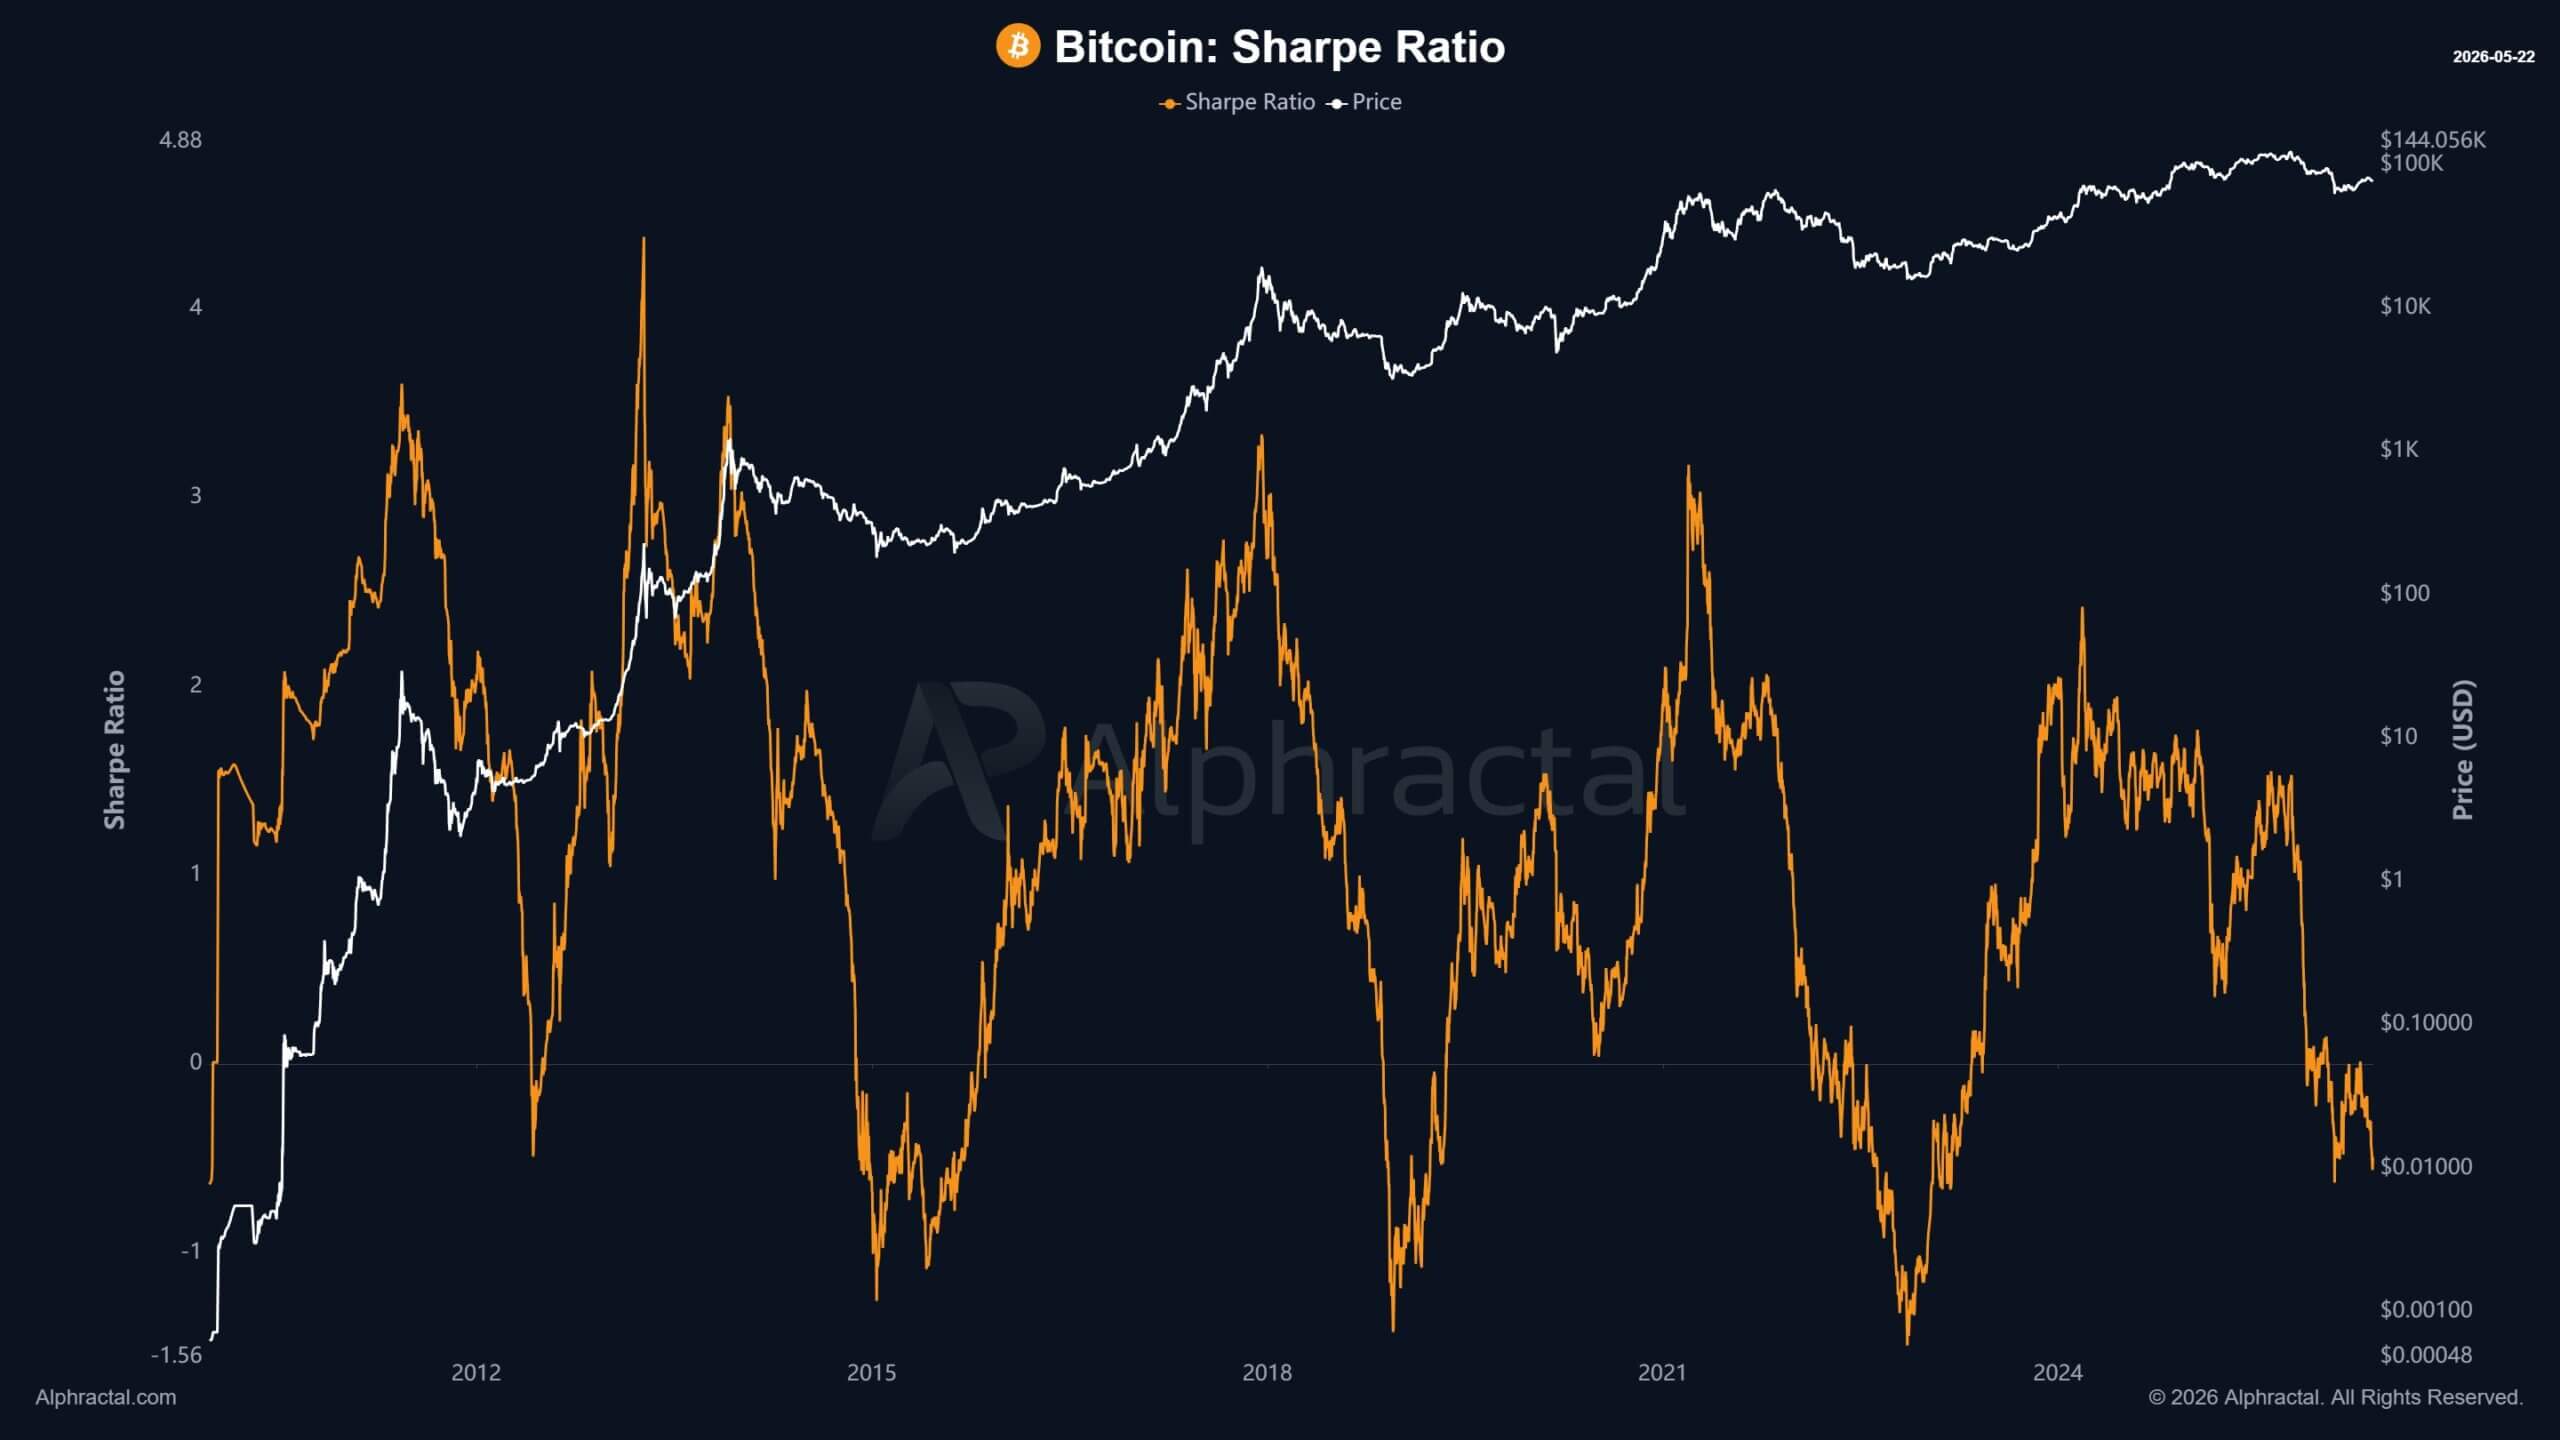
While the data paints a bleak short-term picture, Wedson noted a historical caveat. Prolonged periods in which the Sharpe ratio remains below zero typically represent the market’s worst risk-to-reward phases, but these stretches of intense pessimism and low efficiency have frequently coincided with cyclical market bottoms.
The analytics firm cautioned that the current metrics do not guarantee the market has established a definitive floor.
However, the data confirms that digital assets have entered a zone of extreme risk, stress, and depressed sentiment.